Air Temperatures – The following maximum temperatures were recorded across the state of Hawaii Wednesday afternoon:
Lihue, Kauai – 83 Honolulu, Oahu – 88 Kaneohe, Oahu – 82 Kahului, Maui – 86 Hilo, Hawaii – 82
Kailua-kona – 85 Air Temperaturesranged between these warmest and coolest spots near sea level, and on the highest mountains…at 4 p.m. Wednesday afternoon:
Honolulu, Oahu – 86F Hilo, Hawaii– 80
Haleakala Crater – 57 (near 10,000 feet on Maui)
Mauna Kea summit – 43 (near 14,000 feet on the Big Island) Precipitation Totals – The following numbers represent the largest precipitation totals (inches) during the last 24 hours on each of the major islands, as of Wednesday afternoon:
0.86 Mount Waialeale, Kauai 1.40 Poamoho 2, Oahu
0.20 Molokai
0.00 Lanai
0.00 Kahoolawe 0.92 West Wailuaiki, Maui
0.72 Kealakekua, Big Island Weather Chart – Here’s the latest (automatically updated) weather mapshowing high pressure systems located to the northeast and northwest of Hawaii. This pressure configuration will keep trade winds blowing in the light to moderately strong category Thursday and Friday…locally stronger and gusty.
Satellite and Radar Images: To view the cloud conditions we have here in Hawaii, please use the following satellite links, starting off with theInfrared Satellite Image of the islands to see all the clouds around the state during the day and night. This next image is one that gives close images of the islands only during the daytime hours, and is referred to as a Close-up visible image. This next image shows a larger view of the Pacific…giving perspective to the wider ranging cloud patterns in the Pacific Ocean. To help you keep track of where any showers may be around the islands, here’s the latest animatedradar image.
Hawaii’s Mountains – Here’s a link to the live webcam on the summit of near 14,000 footMauna Kea on the Big Island of Hawaii. The tallest peak on the island of Maui is theHaleakala Crater, which is near 10,000 feet in elevation. These two webcams are available during the daylight hours here in the islands…and when there’s a big moon rising just after sunset for an hour or two! Plus, during the nights and early mornings you will be able to see stars, and the sunrise too…depending upon weather conditions.
Aloha Paragraphs
Nene Goose…the Hawaii state bird Photo Credit: flickr.com
The trade winds remain active here in the Hawaiian Islands Wednesday night into Thursday. These long lasting, early autumn trade winds will blow in the light to moderately strong range, although somewhat stronger in those typically windier areas around the state. The computer forecast models show no end in sight for these trade winds…although they will likely become somewhat lighter Friday into the weekend. As this weather map shows, the source the trade wind flow is a high pressure systems to the northeast and northwest of the islands.
An upper level trough of low pressure is still overhead here in the Aloha state. This will help to destabilize our atmosphere to some degree, making our local clouds more shower prone, especially on the Kauai end of the island chain. As clouds, carried by the trade winds, come under the influence of the trough, we’ll see some enhancement of the showers along the windward sides…making their more generous in their intensity. The daytime heating could cause upcountry afternoon showers on the leeward sides in places too.
The latest GFS (Global Forecast System) computer model continues to show an area of low pressure developing to the south of the Hawaiian Islands over the next several days. This model suggests that this area of low pressure, with its deep tropical moisture, could move into the area west of the state later this weekend into early next week. If it were to manifest as the model suggests, we could see some increased shower activity arriving then. The NWS forecast office in Honolulu says this about the area to our south: "A disturbance 900 miles south southwest of the Big Island of Hawaii is small and weak and is unlikely to develop. Computer models suggest some development may occur farther east over the next few days, but so far there is nothing organized in that area." The NWS has toned down their expectations obviously, so this may be the end of the slight threat. However, The GFS model has been very consistent with its putting wet weather over the state later this weekend into early next week, so I’m going to stick with this for another day to see what the model run looks like Thursday morning.
Note: Here’s what the other computer forecast models are doing with this area, referred to as Invest 96C…which keeps whatever this area develops into, generally to the west of our islands – shown in the upper right hand corner of this map. On the other hand, if this area had any spin to it, which is still possible at this point, this would put our islands on the east side of the system, which could conceivably carry moisture our way!
It’s early Wednesday evening here in Kihei, Maui, as I begin writing this last paragraph of today’s tropical weather narrative from Hawaii. As you were reading in the paragraph above, there’s something that’s trying to take shape to the south of the Hawaiian Islands now. This satellite image shows the area of investigation directly to the south of Hawaii. It will be interesting to see over the next couple of days, if the thunderstorms become more organized in that general area, and then migrate northwest over the ocean to the west of us this weekend. The very latest GFS model run shows this area of rich tropical moisture moving northward towards the state. So, we’ll have to just keep an eye on this unfolding situation. ~~~ Meanwhile, we still have a trough of low pressure over the state, centered over Kauai for the most part. This cold air aloft will keep the chance of showers in the forecast, with an occasional heavier shower on that Kauai end of the Island chain. Otherwise, it appears that our weather will remain just fine through much of the rest of this week…although there may continue to be more clouds showers around than usual for the time being. ~~~ I’ll be back very early Thursday morning with your next new weather narrative, I hope you have a great Wednesday night until then! Aloha for now…Glenn. Interesting:
Fewer people curse the ever-present breeze that sweeps the treeless West Texas landscape these days, where the flat horizon has been overtaken by hundreds of wind turbines that produce electricity for distant city dwellers and new income for rural residents. "Now we love the wind," said Max Watt as she signed her name on the side of a 98-foot-long turbine blade to commemorate the opening of wind farm about 200 miles west of Fort Worth. "We say, ‘blow, blow, blow.’" Wind farms like this one, owned by a subsidiary of German-based E.ON AG, are transforming the rural area’s economy as well as its otherwise featureless horizon. Watt and her husband own land in Nolan County where three E.ON turbines are now spinning, sending electricity to nearby cities and a steady stream of cash into their pockets. While permits to build new cleaner-burning coal plants languish before state utility commissions due to pollution concerns, demand for wind power is resurgent.
Electricity from windmills generates no heat-trapping greenhouse gases and is pumping cash into rural community economies. Generally landowners get a per-turbine lease payment for land – about $900 per turbine a month – plus a percentage of royalties from power production once the windmills are hooked into the grid. The U.S.renewable energy unit of E.ON has completed the first two phases of the Roscoe wind farm that can produce 335.5 megawatts of electricity, or enough to supply 100,000 average Texas homes at full output. When completed in mid-2009, the Roscoe will farm will include 627 turbines with total capacity of 781.5 megawatts, making it the world’s largest wind farm and surpassing the current leader, FPL Energy’s Horse Hollow wind farm in nearby Taylor County, Texas. E.ON Climate and Renewables plans to spend $10 billion in the next three years, mostly on wind projects. About $1.5 billion will be invested in the Roscoe project, one of five E.ON operates in Texas, said Declan Flanagan, E.ON Climate’s North American chief executive.
Interesting2:
Most consumers want companies to do more to protect the environment and reckon that firms should play a leading role in fighting global warming, a worldwide survey showed Tuesday. The poll, of 28,000 Internet users in 51 nations by The Nielsen Company, showed that corporate commitment to green ethics is playing "an increasingly influential role in consumers’ purchasing behavior," Nielsen said. The survey showed that 51 percent of respondents considered it "very important" for firms to improve the environment and another 36 "somewhat important."
Nielsen said it was the first worldwide poll of company ethics and corporate responsibility. "A ‘global conscience’ is one of the biggest trends to have emerged in the last decade," said Amilcar Perez, a vice president of the Nielsen Company in Latin America. The survey was carried out in May, before current financial turmoil. It was unclear whether economic slowdown would undermine environmental concerns, Timmons Roberts, a professor of Sociology at the College of William and Mary in Virginia involved in the poll, told Reuters. "It’s hard to tell. For some consumers who buy fair trade coffee, for instance, it may now part of their budget," he said.
Interesting3:
As if the mysteries of dark matter and dark energy weren’t vexing enough, another baffling cosmic puzzle has been discovered. Patches of matter in the universe seem to be moving at very high speeds and in a uniform direction that can’t be explained by any of the known gravitational forces in the observable universe. Astronomers are calling the phenomenon "dark flow." The stuff that’s pulling this matter must be outside the observable universe, researchers conclude. When scientists talk about the observable universe, they don’t just mean as far out as the eye, or even the most powerful telescope, can see.
In fact there’s a fundamental limit to how much of the universe we could ever observe, no matter how advanced our visual instruments. The universe is thought to have formed about 13.7 billion years ago. So even if light started travelling toward us immediately after the Big Bang, the farthest it could ever get is 13.7 billion light-years in distance. There may be parts of the universe that are farther away (we can’t know how big the whole universe is), but we can’t see farther than light could travel over the entire age of the universe.
Interesting4:
Two terrestrial planets orbiting a mature sun-like star some 300 light-years from Earth recently suffered a violent collision, astronomers at UCLA, Tennessee State University and the California Institute of Technology will report in a December issue of the Astrophysical Journal. "It’s as if Earth and Venus collided with each other," said Benjamin Zuckerman, UCLA professor of physics and astronomy and a co-author on the paper. "Astronomers have never seen anything like this before. Apparently, major catastrophic collisions can take place in a fully mature planetary system." "If any life was present on either planet, the massive collision would have wiped out everything in a matter of minutes — the ultimate extinction event," said co-author Gregory Henry, an astronomer at Tennessee State University (TSU). "A massive disk of infrared-emitting dust circling the star provides silent testimony to this sad fate."
Interesting 5:
Even in the dinosaur world, the small and dainty existed, in the form of a mini-dino that likely didn’t terrorize any creatures other than termites. The newly described dinosaur, called Albertonykus borealis, was about the size of a chicken and is now considered the smallest dinosaur to have existed in North America. "These are bizarre animals. They have long and slender legs, stumpy arms with huge claws and tweezer-like jaws," said researcher Nick Longrich, a paleontologist at the University of Calgary in Canada. The dinosaur belongs to the Alvarezsauridae family, which includes Alvarezsaurus calvoi, a bird-like dinosaur that likely snagged insects for food, and Mononykus olecranus, another lightweight that was equipped with a pair of stubby claws whose function is not known for sure. Like its relatives, A. borealis had long slender hindlegs, which probably made the dinosaur an agile runner. Stout front legs and hands that each sported a massive claw would have easily torn into logs to snag termites.
"Proportionately, the forelimbs are shorter than in a Tyrannosaurus but they are powerfully built, so they seem to have served a purpose," Longrich said. "They are built for digging but too short to burrow, so we think they may have been used to rip open logs in search of insects." In fact, the researchers also found evidence for termite borings in fossilized wood discovered in the same area where the mini-dino fossils showed up, also supporting the idea that this dinosaur was a termite eater. The 70 million-year-old bones of A. borealis were discovered at DryIslandBuffaloJumpProvincialPark in Alberta in 2002 by a team led by Philip Currie of the University of Alberta. The bones were stored at the RoyalTyrrellMuseum in Alberta. It wasn’t until recently that Longrich came upon them.
Interesting6:
Stopping, starting and accelerating your car or SUV can burn unnecessary amounts of fuel while driving. To combat this known challenge, two new technologies have recently come out to provide a greener driving experience. Nissan’s Eco Pedal pushes back on a driver’s lead foot, while Audi’s Travolution tells a driver how fast to go to make the next green light. "They are definitely part of a growing trend and are also definitely a good idea — in the category of ‘every little bit helps,’" said Mike Millikin, editor of the Green Car Congress, a Web site covering sustainable transportation options. Several efforts, such as the consumer-based hypermiling movement and the Ford Motor Company’s EcoDriving Tips, aim to encourage more efficient driving behavior, such as accelerating smoothly and braking gradually." The next step is to put technology in the car to make it easier for consumers to eco-drive, Millikin told LiveScience. "Although the benefits of eco-driving, if realized, will by default happen through mass adoption by drivers of cars that don’t have the spiffy indicators," he said.
Air Temperatures – The following maximum temperatures were recorded across the state of Hawaii Tuesday afternoon:
Lihue, Kauai – 85 Honolulu, Oahu – 87 Kaneohe, Oahu – 83 Kahului, Maui – 84 Hilo, Hawaii – 81
Kailua-kona – 86 Air Temperaturesranged between these warmest and coolest spots near sea level, and on the highest mountains…at 4 p.m. Tuesday afternoon:
Port Allen, Kauai – 86F Hilo, Hawaii– 81
Haleakala Crater – 52 (near 10,000 feet on Maui)
Mauna Kea summit – 43 (near 14,000 feet on the Big Island) Precipitation Totals – The following numbers represent the largest precipitation totals (inches) during the last 24 hours on each of the major islands, as of Tuesday afternoon:
1.00 Mount Waialeale, Kauai
0.60 South Fork Kaukonahua, Oahu
0.07 Molokai
0.00 Lanai
0.00 Kahoolawe 1.31 Puu Kukui, Maui
0.20 Piihonua, Big Island Weather Chart – Here’s the latest (automatically updated) weather mapshowing a 1024 millibar high pressure system located far to the northeast of Hawaii, with a long ridge extending from it to our north. This pressure configuration will keep trade winds blowing in the light to moderately strong category Wednesday and Thursday…locally stronger and gusty.
Satellite and Radar Images: To view the cloud conditions we have here in Hawaii, please use the following satellite links, starting off with theInfrared Satellite Image of the islands to see all the clouds around the state during the day and night. This next image is one that gives close images of the islands only during the daytime hours, and is referred to as a Close-up visible image. This next image shows a larger view of the Pacific…giving perspective to the wider ranging cloud patterns in the Pacific Ocean. To help you keep track of where any showers may be around the islands, here’s the latest animatedradar image.
Hawaii’s Mountains – Here’s a link to the live webcam on the summit of near 14,000 footMauna Kea on the Big Island of Hawaii. The tallest peak on the island of Maui is theHaleakala Crater, which is near 10,000 feet in elevation. These two webcams are available during the daylight hours here in the islands…and when there’s a big moon rising just after sunset for an hour or two! Plus, during the nights and early mornings you will be able to see stars, and the sunrise too…depending upon weather conditions.
Aloha Paragraphs
Young Hula dancers on the island of Lanai Photo Credit: flickr.com
Our early autumn trade winds will remain active across the tropical latitudes of the Hawaiian Islands. These trade winds will blow in the light to moderately strong range, although somewhat stronger in those typically windier areas around the state. The long range computer forecast models show no end in sight for these trade winds…although they will likely begin to become lighter Friday into the weekend.
An upper level trough of low pressure is still overhead here in the Aloha state. This will help to destabilize our atmosphere to some degree, making our local clouds more shower prone, especially on the Kauai end of the island chain. As clouds, carried by the trade winds, come under the influence of the trough, we’ll see some enhancement of the showers along the windward sides. The daytime heating could cause upcountry afternoon showers on the leeward sides too.
The latest GFS (Global Forecast System) computer model continues to show an area of low pressure developing to the south of the Hawaiian Islands over the next several days. This model wants this low pressure area, with its deep tropical moisture, to move northward over the state around next Monday. It’s still too early to lock this forecast down to securely, but it certainly warrants a close eye as we move through the rest of this week. If it were to manifest as the model suggests, we could see increased precipitation arriving then. The model goes on to show an early season cold front pushing southward towards the islands early next week as well. I think it would be wise this early in the game, to adopt a wait and see attitude about all of this for the time being. The NWS forecast office in Honolulu has now started talking about this area: "A weak low level circulation associated with a weak surface trough about 775 miles south of Kona was moving west near 15 miles an hour. Thunderstorms surrounding this system remain poorly organized. Any further development of this system is expected to be slow to occur."
It’s early Tuesday evening here in Kihei, Maui, as I begin writing this last paragraph of today’s tropical weather narrative from Hawaii. As you were reading in the paragraph above, there’s something that might begin to take shape to the south of the Hawaiian Islands over the next couple of days. This satellite image shows the area of investigation directly to the south of Hawaii. At the moment, what we see down there are the typical thunderstorms in the intra-tropical convergence zone…where the trade winds from the northern and southern hemisphere’s meet. It will be interesting to see over the next 2-3 days if the thunderstorms become more organized in that general area, and then migrate northward towards us over the weekend. At this point I’d go so far as to say it might happen…and then again it may not. ~~~ Tuesday turned out to be a nice day, as most days here in the Hawaiian Islands are, regardless of the season. Skies got cloudy locally, with some afternoon showers breaking out here and there, although few and far between. The island of Lanai was reporting heavy rain at 4pm, which is a little unusual. I see little in the way of change to our overall weather pattern Wednesday, continuing on into Friday, at least. ~~~ I’ll be back very early Wednesday morning with your next new weather narrative from paradise! I hope you have a great Tuesday night until then. Aloha for now…Glenn. Interesting:
The first evidence that millions of tons of a greenhouse gas 20 times more potent than carbon dioxide is being released into the atmosphere from beneath the Arctic seabed has been discovered by scientists.The Independent has been passed details of preliminary findings suggesting that massive deposits of sub-sea methane are bubbling to the surface as the Arctic region becomes warmer and its ice retreats. Underground stores of methane are important because scientists believe their sudden release has in the past been responsible for rapid increases in global temperatures, dramatic changes to the climate, and even the mass extinction of species. Scientists aboard a research ship that has sailed the entire length of Russia’s northern coast have discovered intense concentrations of methane — sometimes at up to 100 times background levels — over several areas covering thousands of square miles of the Siberian continental shelf.
In the past few days, the researchers have seen areas of sea foaming with gas bubbling up through "methane chimneys" rising from the sea floor. They believe that the sub-sea layer of permafrost, which has acted like a "lid" to prevent the gas from escaping, has melted away to allow methane to rise from underground deposits formed before the last ice age. They have warned that this is likely to be linked with the rapid warming that the region has experienced in recent years. Methane is about 20 times more powerful as a greenhouse gas than carbon dioxide and many scientists fear that its release could accelerate global warming in a giant positive feedback where more atmospheric methane causes higher temperatures, leading to further permafrost melting and the release of yet more methane. The amount of methane stored beneath the Arctic is calculated to be greater than the total amount of carbon locked up in global coal reserves so there is intense interest in the stability of these deposits as the region warms at a faster rate than other places on earth.
Interesting2:
This month algae as a fuel source made the news several times. Last week, Sapphire Energy announced it received $100 million to help reach its goal of making commercial amounts of algae fuel in three to five years. Investors included Bill Gates Investment company, Cascade Investment, LLC. In June Sapphire received $50 million from investors. At the beginning of the month, Arizona State University (ASU) announced its partnership with Heliae Development, LLC and Science Foundation Arizona (SFAz) to develop a kerosene-based jet fuel derived from algae. Last year ASU researched using algae as jet fuel, in conjunction with UOP, a Honeywell company. Seven days later Solazyme Inc. announced it produced the first algae-derived jet fuel.
To date, the company is the only one that has produced fuels that passed specification testing. In January Solazyme introduced the world’s first cars to run on algae biodiesel at the Sundance Film Festival during the premiere of the documentary Field’s of Fuel. Five years ago, we could not find a single venture capital firm that had ever heard of the concept of a biofuel,” Harrison Dillon, president and chief technology officer of Solazyme, told PBS’ NewsHour last spring. Times have changed, and now venture capitalists are banking on algae biodiesel as the next big fuel. The claims made by Green Chip Stocks (GCS) about algae are a good example. In a report, GCS claims that algae biodiesel could “supply all U.S. diesel power using a mere 0.2 percent of the nation’s land.”
Interesting3:
MIT researchers and colleagues are working to find out whether energy from trees can power a network of sensors to prevent spreading forest fires. What they learn also could raise the possibility of using trees as silent sentinels along the nation’s borders to detect potential threats such as smuggled radioactive materials. The U.S. Forest Service currently predicts and tracks fires with a variety of tools, including remote automated weather stations. But these stations are expensive and sparsely distributed. Additional sensors could save trees by providing better local climate data to be used in fire prediction models and earlier alerts. However, manually recharging or replacing batteries at often very hard-to-reach locations makes this impractical and costly.
The new sensor system seeks to avoid this problem by tapping into trees as a self-sustaining power supply. Each sensor is equipped with an off-the-shelf battery that can be slowly recharged using electricity generated by the tree. A single tree doesn’t generate a lot of power, but over time the "trickle charge" adds up, "just like a dripping faucet can fill a bucket over time," said Shuguang Zhang, one of the researchers on the project and the associate director of MIT’s Center for Biomedical Engineering (CBE). The system produces enough electricity to allow the temperature and humidity sensors to wirelessly transmit signals four times a day, or immediately if there’s a fire. Each signal hops from one sensor to another, until it reaches an existing weather station that beams the data by satellite to a forestry command center in Boise, Idaho.
Interesting4:
Veiled Venus just got a little less mysterious in a new 3-D view that showcases the planet’s powerful winds. The European Space Agency’s Venus Express spacecraft tracked cloud movements hidden within the murky depths of Venus’ southern hemisphere, and scoped out the huge hurricane-like vortexes spinning over the planet’s poles. "Tracking them for long periods of time gives us a precise idea of the speed of the winds that make the clouds move and of the variation in the winds," said Agustin Sanchez-Lavega, a planetary scientist at the Universidad del Pais Vasco in Bilbao, Spain. Sanchez-Lavega and the Venus Express team followed 625 clouds at a 41-mile altitude (66 km), 662 clouds at a roughly 38-mile altitude (61 km), and 932 clouds at altitudes of 28 to 29 miles (45 to 47 km).
An instrument called the Venus Express Visual and Infrared Thermal Imaging Spectrometer (VIRTIS) peered at visible cloud motions at the upper altitudes during the day, and switched to the infrared range of light to see lower cloud movements at night. The team found that the wind speed could vary from almost 230 mph (370 km/h) at the 41-mile altitude to roughly 130 mph (210 km/h) at the 28 to 29 mile altitude range. On Earth, wind speeds can regularly top 100 mph above 18,000 feet, and occasionally hit 200 mph at 30,000 feet. Such results could help researchers begin to understand the complex weather system of Earth’s neighboring planet.
Interesting 5:
Saturn’s rings may be much older and more massive than previously thought, according to a new study. The study’s computer simulation showed how the planet’s rings could date back billions of years ago to the early ages of the solar system, rather than only 100 million years ago (during Earth’s Age of Dinosaurs), as previous observations suggested. The calculations are consistent with recent observations of the rings by the Cassini–Huygensspacecraft currently studying Saturn and its moons. Larry Esposito and Joshua Elliott, both at the University of Colorado, modeled how meteorites smash into the rings, shattering the ring particles and coating each one in a layer of ice and dust.
Before, scientists had assumed that this shattering led to the eventual dissipation of the rings, but a new simulation, created by Glen Stewart and Stuart Robbins of the University of Colorado, shows that after breaking up, the particles could again clump together in a perpetual recycling process. Previously, researchers had thought the rings were relatively young because they appeared bright and pristine, not covered with the detritus of billions of years of meteorites smashing into them. But the new calculations show that if the effect of this clumping and re-clumping is taken into account, the dust would also be recycled through the rings and wouldn’t appear as dark as might be expected.
Interested6:
Summer 2008 in Southern California goes down in the books as cooler than normal. The thermometer in downtown Los Angeles topped 90 degrees Fahrenheit (32.2 degrees Celsius) just once in July, August and the first two-thirds of September. But don’t expect this summer’s respite from the usual blistering heat to continue in the years to come, cautions a group of NASA and university scientists: The long-term forecast calls for increased numbers of scorching days and longer, more frequent heat waves.
One hundred years of daily temperature data in Los Angeles were analyzed by scientists at NASA’s Jet Propulsion Laboratory, Pasadena, Calif.; the University of California, Berkeley; and California State University, Los Angeles.
They found that the number of extreme heat days (above 90 degrees Fahrenheit or 32.2 degrees Celsius in downtown Los Angeles) has increased sharply over the past century. A century ago, the region averaged about two such days a year; today the average is more than 25. In addition, the duration of heat waves (two or more extreme heat days in a row) has also soared, from two-day events a century ago to one- to two-week events today. "We found an astonishing trend — a dramatic increase in the number of heat waves per year," says Arbi Tamrazian, lead author of the study, and a senior at the University of California, Berkeley.
Tamrazian and his colleagues analyzed data from PierceCollege in Woodland Hills, Calif., and the Los Angeles Department of Water and Power in downtown Los Angeles. They tracked the number of extreme heat days and heat waves from 1906 to 2006. The team found that the average annual maximum daytime temperature in Los Angeles has risen by five degrees Fahrenheit (2.8 degrees Celsius) over the past century, and the minimum nighttime temperature has increased nearly as much. They also found that heat waves lasting six or more days have been occurring regularly since the 1970s. More recently, two-week heat waves have become more common.
The team forecasts that in coming decades, we can expect 10- to 14-day heat waves to become the norm. And because these will be hotter heat waves, they will be more threatening to public health. "The bottom line is that we’re definitely going to be living in a warmer Southern California," says study co-author Bill Patzert, a JPL climatologist and oceanographer. "Summers as we now know them are likely to begin in May and continue into the fall. What we call ‘scorcher’ days today will be normal tomorrow. Our snow pack will be less, our fire seasons will be longer, and unhealthy air alerts will be a summer staple. "We’ll still get the occasional cool year like this year," Patzert continued, "but the trend is still towards more extreme heat days and longer heat waves."
Air Temperatures – The following maximum temperatures were recorded across the state of Hawaii Monday afternoon:
Lihue, Kauai – 84
Honolulu, Oahu – 85 Kaneohe, Oahu – 82 Kahului, Maui – 89 Hilo, Hawaii – 84
Kailua-kona – 85 Air Temperaturesranged between these warmest and coolest spots near sea level, and on the highest mountains…at 4 p.m. Monday afternoon:
Kahului, Maui – 85F Barking Sands, Kauai– 79
Haleakala Crater- 48 (near 10,000 feet on Maui)
Mauna Kea summit – 41 (near 14,000 feet on the Big Island) Precipitation Totals – The following numbers represent the largest precipitation totals (inches) during the last 24 hours on each of the major islands, as of Monday afternoon:
0.41 Mount Waialeale, Kauai 0.66 Oahu Forest NWR, Oahu
0.24 Molokai
0.25 Lanai
0.02 Kahoolawe 0.53 Kaupo Gap, Maui
0.49 Waiakea Uka, Big Island Weather Chart – Here’s the latest (automatically updated) weather mapshowing a high pressure system located far to the northeast of Hawaii, with a second high to the west-northwest…connected by a long ridge. This pressure configuration will keep trade winds blowing in the light to moderately strong category Tuesday and Wednesday…locally stronger and gusty.
Satellite and Radar Images: To view the cloud conditions we have here in Hawaii, please use the following satellite links, starting off with theInfrared Satellite Image of the islands to see all the clouds around the state during the day and night. This next image is one that gives close images of the islands only during the daytime hours, and is referred to as a Close-up visible image. This next image shows a larger view of the Pacific…giving perspective to the wider ranging cloud patterns in the Pacific Ocean. To help you keep track of where any showers may be around the islands, here’s the latest animatedradar image.
Hawaii’s Mountains – Here’s a link to the live webcam on the summit of near 14,000 footMauna Kea on the Big Island of Hawaii. The tallest peak on the island of Maui is theHaleakala Crater, which is near 10,000 feet in elevation. These two webcams are available during the daylight hours here in the islands…and when there’s a big moon rising just after sunset for an hour or two! Plus, during the nights and early mornings you will be able to see stars, and the sunrise too…depending upon weather conditions.
The long lasting trade winds will remain active over the Hawaiian Islands. The trade winds will blow in the light to moderately strong range, although somewhat stronger in those typically windier areas around the state. The long range computer forecast models show no end in sight for these trade winds…which will last through the rest of this week.
An upper level trough of low pressure is over Hawaii, which can be thought of as colder air aloft. This will help to destabilize our atmosphere to some degree, making our local clouds more shower prone. As clouds, carried by the trade winds, come under the influence of the trough, we’ll see some enhancement of the showers along the windward sides. This upper trough sticks around through much of this week, which keeps the chance of enhanced showers around…especially on the Kauai end of the island chain.
It may be a little too early to point this out, but the computer models are showing an area of moisture coming northward over the Hawaiian Islands next Monday.The models show a deep trough of low pressure digging southward towards the tropics. This trough has a surface reflection, in the form of a fairly vigorous early season cold front. The frontal boundary doesn’t make it all the way to Hawaii, but about that same time…a surge of tropical moisture moves northward towards our islands. If things go the way the GFS computer model suggests now, we could start off next week with increased showers. Again, the models could back off on this long range forecast, but I’ll keep an eye on this developing situation as we move forward into the week.
It’s early Monday evening here in Kihei, Maui, as I begin writing this last paragraph of today’s tropical weather narrative from Hawaii. The threat of heavy showers earlier Monday, really didn’t manifest as expected. The showery clouds rode in on the trade winds alright, but took a path north of the state…just missing us. Oh well, that’s the way it goes sometimes, we could have used the moisture though. At any rate, the upper trough of low pressure remains in place, which will keep the atmosphere at least a bit unstable this week. This in turn will enhance whatever showers that happen to fall, although looking at satellite imagery…there’s not a lot of clouds coming in our direction, at least nothing organized. Here’s a satellite image, showing the nature of the scattered clouds upstream, in relation to the trade wind flow. ~~~ Today was the first partial autumn day, as we gradually leave our summer season behind us. This certainly doesn’t mean we won’t be seeing lots more in the way of summery weather as we move forward! I’ll be back very early Tuesday morning with your next new weather narrative, I hope you have a great Monday night until then. Aloha for now…Glenn. Interesting:
It may be the biggest conservation victory for the US in decades. It ensures that massive amounts of greenhouse gases won’t be released to add to global warming. It ensures an abundance of birds for generations of Americans to enjoy. And you may not have heard anything about it. That’s because it just happened in Ontario, Canada. Over the summer, Ontario‘s premier, Dalton McGuinty, announced that at least 55 million acres — half of the province’s boreal forest — will be off limits to development. And he has promised no new mining or logging projects until local land-use plans have support from native communities. The scale of the decision is staggering, and it commits Ontario to setting aside lands more than twice the size of Pennsylvania as parks or wildlife refuges. Equally impressive was Premier McGuinty’s strong reliance on the recommendation by scientists, led by Nobel Prize-winning authors of the International Panel on Climate Change, to make that decision.
Scientists identify the Canadian boreal forest, larger than the remaining Brazilian Amazon, as one of the world’s largest and most intact forest ecosystems. It stores 186 billion tons of carbon – equivalent to 27 years of the world’s carbon dioxide fossil fuel emissions – and provides habitat for billions of breeding birds, plus many other wildlife species. There are herds of caribou, healthy populations of bears and wolves, and some of the world’s last wild undammed rivers and pristine lakes. Many of the birds either Millions of dark-eyed juncos, white-throated sparrows and Swainson’s thrushes are among the songbirds that raise their young in this now-protected region and that will soon be arriving in Pennsylvania and New Jersey. Hunters have reason to be happy, too, since those forests also sustain huge numbers of waterfowl like American black ducks, common goldeneyes and buffleheads that grace US waters in the winte
Interesting2:
Climate has been implicated by a new study as a major driver of wildfires in the last 2,000 years. But human activities, such as land clearance and fire suppression during the industrial era (since 1750) have created large swings in burning, first increasing fires until the late 1800s, and then dramatically reducing burning in the 20th century. The study by a nine-member team from seven institutions — led by Jennifer R. Marlon, a doctoral student in geography at the University of Oregon — appeared online Sunday ahead of regular publication in the journal Nature Geoscience. The team analyzed 406 sedimentary charcoal records from lake beds on six continents.
A 100-year decline in wildfires worldwide — from 1870 to 1970 — was recorded despite increasing temperatures and population growth, researchers found. "Based on the charcoal record," Marlon said, "we believe the reduction in the amount of biomass burned during those 100 years can be attributed to a global expansion of agriculture and intensive grazing of livestock that reduced fuels plus general landscape fragmentation and fire-management efforts." Observations of increased burning associated with global warming and fuel build-up during the past 30 years, however, are not yet included in the sediment record.
Interesting3:
Theworst dust storm in 40 years was Monday dusting the snow with an orange powder in the alpine region of Australia‘s south-east corner and bringing what locals call mud rain. Winds of up to 100 kilometres per hour are lifting soil from the arid interior of New South Wales and dumping it nearer the coast. When combined with rain, it can fall with the consistency of watery mud. The ochre dust has swept across Mount Kosciusko, flat Australia‘s highest mountain, giving what resident Darren Nielsen told national broadcaster ABC was an "extremely bizarre" aspect. "Seeing the sky and just the whole village in darkness and the mountain orange is a really eerie sort of feeling," he said.
Interesting4:
To help figure out what’s happening inside the fastest-moving Greenland glacier, a U.S. rocket scientist sent 90 rubber ducks into the ice, hoping someone finds them if they emerge in Baffin Bay. The common yellow plastic bath toys are one part of a sophisticated experiment to determine why glaciers speed up in the summer in their march to the sea, said Alberto Behar of NASA’s Jet Propulsion Laboratory in California. The Jakobshavn Glacier is very likely the source of the iceberg that sank the Titanic in 1912 and researchers focus on it because it discharges nearly 7 percent of all the ice coming off Greenland. As the planet warms, its melting ice sheet could make oceans rise this century. "It’s a beautiful place to visit. You can watch these icebergs continuously march across and fall into the ocean," Behar said. What you can’t see is how melting water moves through the ice.
"Right now it’s not understood what causes the glaciers themselves to surge in the summer," Behar said. One theory is that the summer sun melts ice on the top glacial surface, creating pools that flow into tubular holes in the glacier called moulins. The moulins can carry some water all the way to the underside of the glacier, where it acts as a lubricant to speed the movement of ice toward the coast. But because it cannot be seen, no one really knows what occurs. That’s where the rubber ducks come in, along with a probe about the size of a football loaded with a GPS transmitter and instruments that can tell much about the glacier’s innards. In August, Behar flew by helicopter to a place on the glacier where rivers of melted ice flow into moulins. Researchers lowered the probe into one moulin by rope and released it into the water flowing beneath the ice.
Air Temperatures – The following maximum temperatures were recorded across the state of Hawaii Sunday afternoon:
Lihue, Kauai – 85 Honolulu, Oahu – 89 Kaneohe, Oahu – 79 Kahului, Maui – 86 Hilo, Hawaii – 83
Kailua-kona – 86 Air Temperaturesranged between these warmest and coolest spots near sea level, and on the highest mountains…at 4 p.m. Sunday afternoon:
Kaneohe, Oahu – 86F Kailua-Kona– 79
Haleakala Crater- 50 (near 10,000 feet on Maui)
Mauna Kea summit – 39 (near 14,000 feet on the Big Island) Precipitation Totals – The following numbers represent the largest precipitation totals (inches) during the last 24 hours on each of the major islands, as of Sunday afternoon: 0.97 Mount Waialeale, Kauai
0.24 Oahu Forest NWR, Oahu
0.00 Molokai
0.00 Lanai
0.00 Kahoolawe 0.35 Puu Kukui, Maui
0.39 Kealakekua, Big Island Weather Chart – Here’s the latest (automatically updated) weather mapshowing a 1029 millibar high pressure system located far to the northeast of Hawaii. This pressure configuration will keep trade winds blowing in the light to moderately strong category Monday and Tuesday…locally stronger and gusty.
Satellite and Radar Images: To view the cloud conditions we have here in Hawaii, please use the following satellite links, starting off with theInfrared Satellite Image of the islands to see all the clouds around the state during the day and night. This next image is one that gives close images of the islands only during the daytime hours, and is referred to as a Close-up visible image. This next image shows a larger view of the Pacific…giving perspective to the wider ranging cloud patterns in the Pacific Ocean. To help you keep track of where any showers may be around the islands, here’s the latest animatedradar image.
Hawaii’s Mountains – Here’s a link to the live webcam on the summit of near 14,000 footMauna Kea on the Big Island of Hawaii. The tallest peak on the island of Maui is theHaleakala Crater, which is near 10,000 feet in elevation. These two webcams are available during the daylight hours here in the islands…and when there’s a big moon rising just after sunset for an hour or two! Plus, during the nights and early mornings you will be able to see stars, and the sunrise too…depending upon weather conditions.
Aloha Paragraphs
Great sunset…Napili, Maui Photo Credit: flickr.com
The trade winds will continue to blow in the light to moderately strong range. The trade winds will remain with us through the new week ahead. It appears that these winds may calm down some after mid-week, as a cold front approaches the state from the northwest direction…pushing a ridge of high pressure down closer to the Kauai end of the island chain.
Showers were rather limited Sunday in most areas, but then increase tonight into Monday.An upper level trough of low pressure is now over us, which can be thought of as colder air aloft. This will help to destabilize our atmosphere to some degree, making our local clouds more shower prone…as we saw along the Kona slopes Sunday afternoon. We see an area of showery looking clouds coming our way from the east, associated with a surface trough of low pressure. As these clouds come under the influence of the trough higher in the atmosphere, we should see increasing showers or rain begin Sunday night through Monday. The surface trough moves away by Tuesday, but the upper trough sticks around, keeping the chance of showers around through the next 3-4 days.
It’s early Sunday evening here in Kula, Maui, as I begin writing this last paragraph of today’s tropical weather narrative from Hawaii. We’re moving through the last few hours of summer 2008. The official beginning of autumn occurs at 5:44am Monday morning here in the islands. Summer will give way to the autumn season with increased showers later Sunday into the first day of fall. ~~~ The showers noted in the paragraph above haven’t reached our islands yet, and will take until Sunday evening or night, before we see definite signs of their presence. The exception to this was in the Kona area, where locally heavy rains developed. This satellite image shows this area of clouds to our east, which are riding in our direction, carried on the trade winds…which will keep us off and on wet into Monday. Sunday was a good day, with only the Kona area getting wet, where there was a flood advisory issued by the NWS office in Honolulu. The aforementioned showers will arrive over the Big Islands windward sides this evening, Maui’s windward sides tonight, and up the island chain to Oahu and Kauai Monday morning. ~~~ I’ll be back very early Monday morning with your next new weather narrative, I hope you have a great Sunday night until then! Aloha for now…Glenn.
Interesting:
Kraft is the latest company to turn part of its waste stream into a bigger bottom line. Two cheese plants in New York will turn used whey into energy in a move that will supplant a third of the facilities’ natural gas purchases. The company also will avoid the expense of hauling the waste away. Digesters at the company’s Lowville plant, which makes Philadelphia cream cheese, and a string cheese plant in Campbell turn the whey into biogas. It’s part of the company’s broader efforts to green operations in the areas of agriculture, packaging, energy, water, waste and transportation. "Our facilities have previously used strategies such as concentrating the whey to reduce volume and finding outlets for it to be used as animal feed, or for fertilizer on environmentally approved farm fields," said Sustainability Vice President Steve Yucknut.
"Both methods required transporting the whey off-site. Now, we’re reducing the associated CO2 emissions that are part of transporting waste, discharging cleaner wastewater from our on-site treatment systems, and creating enough alternative energy to heat more than 2,600 homes in the Northeast." The company’s broader goals include reducing energy consumption and energy-related CO2 by 25 percent, and manufacturing plant waste by 15 percent. Rather than sending it to landfills, companies from across several sectors are increasingly viewing waste as a commodity. General Motors, for example, recently announced that half of its manufacturing plants worldwide would reach landfill-free status by 2010, with scrap metal sales topping $1 billion. McDonald’s successfully transformed waste into electricity earlier this year at several United Kingdom restaurants, while Chrysler is converting used paint solids from two St. Louis assembly plants into electricity. Heinz also is working on a program to transform used potato peels into energy.
Interesting2:
The Lake Tanganyika area, in southeast Africa, is home to nearly 130 million people living in four countries that bound the lake, the second deepest on Earth. Scientists have known that the region experiences dramatic wet and dry spells, and that rainfall profoundly affects the area’s people, who depend on it for agriculture, drinking water and hydroelectric power. Scientists thought they knew what caused those rains: a season-following belt of clouds along the equator known as the Intertropical Convergence Zone (ITCZ). Specifically, they believed the ITCZ and rainfall and temperature patterns in the Lake Tanganyika area marched more or less in lockstep. When the ITCZ moved north of the equator during the northern summer, the heat (and moisture) would follow, depriving southeast Africa of moisture and rainfall. When the ITCZ moved south of the equator during the northern winter, the moisture followed, and southeast Africa got rain.
Now a Brown-led research team has discovered the ITCZ may not be the key to southeast Africa‘s climate after all. Examining data from core sediments taken from Lake Tanganyika covering the last 60,000 years, the researchers report in this week’s Science Express that the region’s climate instead appears to be linked with ocean and atmospheric patterns in the Northern Hemisphere. The finding underscores the interconnectedness of the Earth’s climate — how weather in one part of the planet can affect local conditions half a world away. The discovery also could help scientists understand how tropical Africa will respond to global warming, said Jessica Tierney, a graduate student in Brown’s Geological Sciences Department and the paper’s lead author.
Interesting3:
Abrupt climate change is a potential menace that hasn’t received much attention. That’s about to change. Through its Climate Change Prediction Program, the U.S. Department of Energy’s Office of Biological and Environmental Research (OBER) recently launched IMPACTS – Investigation of the Magnitudes and Probabilities of Abrupt Climate Transitions – a program led by William Collins of Berkeley Lab’s Earth Sciences Division (ESD) that brings together six national laboratories to attack the problem of abrupt climate change, or ACC. Sparked by the 2007 Nobel Peace Prize that was shared by Al Gore and the Intergovernmental Panel on Climate Change (IPCC), the reality of global warming finally got through to the majority of the world’s population. Most people think of climate change as something that occurs only gradually, however, with average temperature changing two or three degrees Celsius over a century or more; this is the rate at which ‘forcing’ mechanisms operate, such as the accumulation of carbon dioxide in the atmosphere due to the burning of fossil fuels or widespread changes in land use.
But climate change has occurred with frightening rapidity in the past and will almost certainly do so again. Perhaps the most famous example is the reverse hiccup in a warming trend that began 15,000 years ago and eventually ended the last ice age. Roughly 2,000 years after it started, the warming trend suddenly reversed, and temperatures fell back to near-glacial conditions; Earth stayed cold for over a thousand years, a period called the Younger Dryas (named for an alpine wildflower). Then warming resumed so abruptly, that global temperatures shot up 10 °C, in just 10 years. Because civilizations hadn’t yet emerged, complex human societies escaped this particular roller-coaster ride. Nevertheless, some form of abrupt climate change is highly likely in the future, with wide-ranging economic and social effects.
Interesting4:
The Caribbean and GulfCoast have seen a spate of devastating hurricanes in recent years that have cost billions of dollars and thousands of lives. As residents recover from the latest hits, they may wonder about the potential for future Ike’s and Katrina’s. Hurricanes, of course, are nothing new to the Atlantic and Gulf of Mexico, where tropical storms form between June and November each year. But many factors, both natural and man-made, can affect the number, strength, size and impact of the storms that form each season. For example, the recent surge in storms followed an almost two-decade lull that was part of a natural cycle in hurricane formation. During that lull, new coastal residents built homes in what they thought was a paradise. But now they’ve found out just how susceptible they are to nature’s wrath. And it looks like the situation might only get worse. In 2003, more than half the U.S. population (or about 153 million people) lived along the Gulf and Southeastern U.S. coastline — an increase of 33 million people from 1980 — and that number is just expected to keep rising.
The buildup of these communities in recent decades and the environmental damage that development has caused exacerbate the impact of hurricanes. "There’s been an explosion of population along our coast," said Amanda Staudt, a climate scientist with the National Wildlife Federation (NWF). "That’s just putting a lot more people in harm’s way." This is particularly true in Florida, Texas and North Carolina, where populations are increasing the fastest. Hurricanes are especially a threat for homes right on the beach or on barrier islands, such as Galveston, because they receive the full brunt of a hurricane’s storm surge. Coastal features such as barrier islands and wetlands act as natural protection against a hurricane’s storm surge, slowing it down and absorbing some of the impact. Studies have shown that every mile of wetlands reduces storm surge by about 3 to 9 inches and every acre reduces the cost of damages from a storm by $3,300, Staudt said. "Our wetlands and barrier islands … are our first line of defense," she said.
Air Temperatures – The following maximum temperatures were recorded across the state of Hawaii Saturday afternoon:
Lihue, Kauai – 85 Honolulu, Oahu – 89 Kaneohe, Oahu – 83 Kahului, Maui – 89 Hilo, Hawaii – 83
Kailua-kona – 86 Air Temperaturesranged between these warmest and coolest spots near sea level, and on the highest mountains…at 4 p.m. Saturday afternoon:
Honolulu, Oahu – 87F Kaneohe, Oahu– 81
Haleakala Crater- 50 (near 10,000 feet on Maui)
Mauna Kea summit – 41 (near 14,000 feet on the Big Island) Precipitation Totals – The following numbers represent the largest precipitation totals (inches) during the last 24 hours on each of the major islands, as of Saturday afternoon:
0.47 Lihue airport, Kauai 2.01 Lihue, Kauai, Oahu
0.00 Molokai
0.01 Lanai
0.00 Kahoolawe 0.07 Oheo Gulch, Maui
0.29 Kealakekua, Big Island Weather Chart – Here’s the latest (automatically updated) weather mapshowing a 1024 millibar high pressure system located to the northeast of Hawaii. This pressure configuration will keep trade winds blowing in the light to moderately strong category Sunday and Monday…locally stronger and gusty.
Satellite and Radar Images: To view the cloud conditions we have here in Hawaii, please use the following satellite links, starting off with theInfrared Satellite Image of the islands to see all the clouds around the state during the day and night. This next image is one that gives close images of the islands only during the daytime hours, and is referred to as a Close-up visible image. This next image shows a larger view of the Pacific…giving perspective to the wider ranging cloud patterns in the Pacific Ocean. To help you keep track of where any showers may be around the islands, here’s the latest animatedradar image.
Hawaii’s Mountains – Here’s a link to the live webcam on the summit of near 14,000 footMauna Kea on the Big Island of Hawaii. The tallest peak on the island of Maui is theHaleakala Crater, which is near 10,000 feet in elevation. These two webcams are available during the daylight hours here in the islands…and when there’s a big moon rising just after sunset for an hour or two! Plus, during the nights and early mornings you will be able to see stars, and the sunrise too…depending upon weather conditions.
Aloha Paragraphs
The gorgeous island of Kauai Photo Credit: flickr.com
Our trade winds have picked up in strength Saturday.These trade winds will gain even a bit more speed Sunday. As high pressure strengthens this weekend to our north, our local trade winds are getting a lift, becoming moderately strong as we push into the new week. The trade winds will remain with us through the first part of the new week ahead. Looking further ahead, it appears that the trade winds may calm down quite a bit after mid-week, as a cold front approaches the state from the northwest direction…pushing a ridge of high pressure deeper into the tropics.
Showers will be most active along the windward sides, with a possible increase in showers over the next several days.An upper level trough of low pressure is edging our way now, which can simply be thought of as cooler air aloft. This will help to destabilize our atmosphere to some degree, making our local clouds more shower prone. This influence should be most pronounced later Sunday through the first day or two of the new week. Meanwhile, the leeward sides may begin to see some showers during the afternoon hours too…which could become locally quite generous as well.
It’s early Saturday evening here in Kula, Maui, as I begin writing this last paragraph of today’s tropical weather narrative from Hawaii. We’re now into the last few hours of summer 2008. The official beginning of autumn occurs at 5:44am Monday morning here in the islands. Summer will give way to the autumn season with a chance of increased showers later Sunday into Monday or Tuesday. The wild card at this point, will be whether or not there will be enough moisture around to feed these heavier showers. ~~~ Friday evening I went to see the new film called Righteous Kill (2008), starring Robert De Niro and Al Pacino. The long and short of this film is that a pair of veteran New York City police detectives are on the trail of a vigilante serial killer, in this adrenaline fueled psychological thriller. The critics have not been kind to this film, as an example: "Al Pacino and Robert De Niro do their best to elevate this dowdy genre exercise, but even these two greats can’t resuscitate the film’s hackneyed script." Despite the low ratings for this film, I went to see it anyway, as I’m fairly easy to please, and a sucker for these kinds of action/adventure flicks. I have to agree, that it wasn’t the best film I’ve seen this year, far from it, but for me, it was good enough to have made it worth my while to sit through. I found it a bit clunky at times, although the interaction between Mr. De Niro and Mr. Pacino, was entertaining. There was an interesting twist at the end, which caught me by surprise. Here’s a trailer for this film. ~~~ Saturday was a good day in a weather sense, with lots of sunshine, and just a bit more hazy than we’ve seen lately. The showers noted in the paragraphs above haven’t reached our islands yet, and may take until late Sunday before we see definite signs of their presence. The cooling air Saturday night might bring an increase in showers along the windward sides, but Sunday night into Monday will be the more favorable time frame for the increase in showers. ~~~ Sunset was great here in Kula, it was warm, even after the sun set. Typically I’d have a fleece parka vest, or its companion full parka, on at this time of day, but even now, at 640pm Saturday evening, its still a relatively warm 67.3F degrees, at this 3,100 foot elevation, on this western slope of the Haleakala Crater. I’ll be back Sunday morning with your next new weather narrative, I hope you have a great Saturday night until then! Aloha for now…Glenn.
Interesting:
Kraft is the latest company to turn part of its waste stream into a bigger bottom line. Two cheese plants in New York will turn used whey into energy in a move that will supplant a third of the facilities’ natural gas purchases. The company also will avoid the expense of hauling the waste away. Digesters at the company’s Lowville plant, which makes Philadelphia cream cheese, and a string cheese plant in Campbell turn the whey into biogas. It’s part of the company’s broader efforts to green operations in the areas of agriculture, packaging, energy, water, waste and transportation. "Our facilities have previously used strategies such as concentrating the whey to reduce volume and finding outlets for it to be used as animal feed, or for fertilizer on environmentally approved farm fields," said Sustainability Vice President Steve Yucknut.
"Both methods required transporting the whey off-site. Now, we’re reducing the associated CO2 emissions that are part of transporting waste, discharging cleaner wastewater from our on-site treatment systems, and creating enough alternative energy to heat more than 2,600 homes in the Northeast." The company’s broader goals include reducing energy consumption and energy-related CO2 by 25 percent, and manufacturing plant waste by 15 percent. Rather than sending it to landfills, companies from across several sectors are increasingly viewing waste as a commodity. General Motors, for example, recently announced that half of its manufacturing plants worldwide would reach landfill-free status by 2010, with scrap metal sales topping $1 billion. McDonald’s successfully transformed waste into electricity earlier this year at several United Kingdom restaurants, while Chrysler is converting used paint solids from two St. Louis assembly plants into electricity. Heinz also is working on a program to transform used potato peels into energy.
Interesting2:
The Lake Tanganyika area, in southeast Africa, is home to nearly 130 million people living in four countries that bound the lake, the second deepest on Earth. Scientists have known that the region experiences dramatic wet and dry spells, and that rainfall profoundly affects the area’s people, who depend on it for agriculture, drinking water and hydroelectric power. Scientists thought they knew what caused those rains: a season-following belt of clouds along the equator known as the Intertropical Convergence Zone (ITCZ). Specifically, they believed the ITCZ and rainfall and temperature patterns in the Lake Tanganyika area marched more or less in lockstep. When the ITCZ moved north of the equator during the northern summer, the heat (and moisture) would follow, depriving southeast Africa of moisture and rainfall. When the ITCZ moved south of the equator during the northern winter, the moisture followed, and southeast Africa got rain.
Now a Brown-led research team has discovered the ITCZ may not be the key to southeast Africa‘s climate after all. Examining data from core sediments taken from Lake Tanganyika covering the last 60,000 years, the researchers report in this week’s Science Express that the region’s climate instead appears to be linked with ocean and atmospheric patterns in the Northern Hemisphere. The finding underscores the interconnectedness of the Earth’s climate — how weather in one part of the planet can affect local conditions half a world away. The discovery also could help scientists understand how tropical Africa will respond to global warming, said Jessica Tierney, a graduate student in Brown’s Geological Sciences Department and the paper’s lead author.
Interesting3:
Abrupt climate change is a potential menace that hasn’t received much attention. That’s about to change. Through its Climate Change Prediction Program, the U.S. Department of Energy’s Office of Biological and Environmental Research (OBER) recently launched IMPACTS – Investigation of the Magnitudes and Probabilities of Abrupt Climate Transitions – a program led by William Collins of Berkeley Lab’s Earth Sciences Division (ESD) that brings together six national laboratories to attack the problem of abrupt climate change, or ACC. Sparked by the 2007 Nobel Peace Prize that was shared by Al Gore and the Intergovernmental Panel on Climate Change (IPCC), the reality of global warming finally got through to the majority of the world’s population. Most people think of climate change as something that occurs only gradually, however, with average temperature changing two or three degrees Celsius over a century or more; this is the rate at which ‘forcing’ mechanisms operate, such as the accumulation of carbon dioxide in the atmosphere due to the burning of fossil fuels or widespread changes in land use.
But climate change has occurred with frightening rapidity in the past and will almost certainly do so again. Perhaps the most famous example is the reverse hiccup in a warming trend that began 15,000 years ago and eventually ended the last ice age. Roughly 2,000 years after it started, the warming trend suddenly reversed, and temperatures fell back to near-glacial conditions; Earth stayed cold for over a thousand years, a period called the Younger Dryas (named for an alpine wildflower). Then warming resumed so abruptly, that global temperatures shot up 10 °C, in just 10 years. Because civilizations hadn’t yet emerged, complex human societies escaped this particular roller-coaster ride. Nevertheless, some form of abrupt climate change is highly likely in the future, with wide-ranging economic and social effects.
Interesting4:
The Caribbean and GulfCoast have seen a spate of devastating hurricanes in recent years that have cost billions of dollars and thousands of lives. As residents recover from the latest hits, they may wonder about the potential for future Ike’s and Katrina’s. Hurricanes, of course, are nothing new to the Atlantic and Gulf of Mexico, where tropical storms form between June and November each year. But many factors, both natural and man-made, can affect the number, strength, size and impact of the storms that form each season. For example, the recent surge in storms followed an almost two-decade lull that was part of a natural cycle in hurricane formation. During that lull, new coastal residents built homes in what they thought was a paradise. But now they’ve found out just how susceptible they are to nature’s wrath. And it looks like the situation might only get worse. In 2003, more than half the U.S. population (or about 153 million people) lived along the Gulf and Southeastern U.S. coastline — an increase of 33 million people from 1980 — and that number is just expected to keep rising.
The buildup of these communities in recent decades and the environmental damage that development has caused exacerbate the impact of hurricanes. "There’s been an explosion of population along our coast," said Amanda Staudt, a climate scientist with the National Wildlife Federation (NWF). "That’s just putting a lot more people in harm’s way." This is particularly true in Florida, Texas and North Carolina, where populations are increasing the fastest. Hurricanes are especially a threat for homes right on the beach or on barrier islands, such as Galveston, because they receive the full brunt of a hurricane’s storm surge. Coastal features such as barrier islands and wetlands act as natural protection against a hurricane’s storm surge, slowing it down and absorbing some of the impact. Studies have shown that every mile of wetlands reduces storm surge by about 3 to 9 inches and every acre reduces the cost of damages from a storm by $3,300, Staudt said. "Our wetlands and barrier islands … are our first line of defense," she said.
Air Temperatures – The following maximum temperatures were recorded across the state of Hawaii Friday afternoon:
Lihue, Kauai – 84
Honolulu, Oahu – 86 Kaneohe, Oahu – 82 Kahului, Maui – 88 Hilo, Hawaii – 83
Kailua-kona – 85 Air Temperaturesranged between these warmest and coolest spots near sea level, and on the highest mountains…at 5 p.m. Friday evening:
Kahului, Maui – 84F Hilo, Hawaii– 77
Haleakala Crater- 54 (near 10,000 feet on Maui)
Mauna Kea summit – 43 (near 14,000 feet on the Big Island) Precipitation Totals – The following numbers represent the largest precipitation totals (inches) during the last 24 hours on each of the major islands, as of Friday afternoon:
0.15 Lihue airport, Kauai 0.80 Hakipuu Mauka, Oahu
0.07 Molokai
0.00 Lanai
0.00 Kahoolawe 0.46 Oheo Gulch, Maui
0.25 Kahua Ranch, Big Island Weather Chart – Here’s the latest (automatically updated) weather mapshowing two fairly weak high pressure systems located to the north, and far to the east-northeast of Hawaii. This pressure configuration will keep trade winds on the light side light side Friday and Saturday.
Satellite and Radar Images: To view the cloud conditions we have here in Hawaii, please use the following satellite links, starting off with theInfrared Satellite Image of the islands to see all the clouds around the state during the day and night. This next image is one that gives close images of the islands only during the daytime hours, and is referred to as a Close-up visible image. This next image shows a larger view of the Pacific…giving perspective to the wider ranging cloud patterns in the Pacific Ocean. To help you keep track of where any showers may be around the islands, here’s the latest animatedradar image.
Hawaii’s Mountains – Here’s a link to the live webcam on the summit of near 14,000 footMauna Kea on the Big Island of Hawaii. The tallest peak on the island of Maui is theHaleakala Crater, which is near 10,000 feet in elevation. These two webcams are available during the daylight hours here in the islands…and when there’s a big moon rising just after sunset for an hour or two! Plus, during the nights and early mornings you will be able to see stars, and the sunrise too…depending upon weather conditions.
Aloha Paragraphs
The windward side of Oahu Photo Credit: flickr.com
Our trade winds will be gradually picking up in strength through the weekend.These trade winds will remain on the light side of the wind spectrum Saturday, but gain speed moving into Sunday. As high pressure strengthens later this weekend, our local trade winds will get a lift, becoming moderately strong as we push into the new week. The trade winds will remain with us through at least the next week.
We’ll see a few showers along the windward sides, with the chance of a shower along the leeward sides too.The night and early morning hours will be the favored time of day for the windward biased showers. The light winds, along with the daytime heating of the islands, will cause clouds to form over and around the leeward slopes during the afternoons…with a few showers. We may see an increase in showers, which could be locally heavy later this weekend into early next week.
It’s early Friday evening here in Kihei, Maui, as I begin writing this last paragraph of today’s tropical weather narrative from Hawaii. The computer models continue showing an upper level low pressure system moving over the islands this weekend. The cool air aloft in association with this upper air feature, could enhance our windward biased showers, and cause showers to increase over the leeward slopes too. ~~~ We’re heading into the last weekend of summer 2008. The official beginning of autumn occurs at 5:44am Monday morning here in the islands. Summer will give way to the autumn season with a chance of increased showers Sunday into Monday. The good part of this is that both the windward and leeward sides will have a chance to receive some much needed water. ~~~ I’m about ready to leave Kihei for the short 15-20 minute drive to Kahului. I’m going to see the new film called Righteous Kill (2008), starring Robert De Niro and Al Pacino. The long and short of this film is that a pair of veteran New York City police detectives are on the trail of a vigilante serial killer, in this adrenaline fueled psychological thriller. The critics have not been kind to this film, as an example: "Al Pacino and Robert De Niro do their best to elevate this dowdy genre exercise, but even these two greats can’t resuscitate the film’s hackneyed script." Oh well, I’m going to see it anyway, as I’m fairly easy to please, and a sucker for these kinds of action/adventure flicks. Here’s a trailer for this film. I’ll be back early Saturday morning with your next new weather narrative, including my thoughts on the film. I hope you have you have a great Friday night until then! Aloha for now…Glenn.
Interesting:
Kraft is the latest company to turn part of its waste stream into a bigger bottom line. Two cheese plants in New York will turn used whey into energy in a move that will supplant a third of the facilities’ natural gas purchases. The company also will avoid the expense of hauling the waste away. Digesters at the company’s Lowville plant, which makes Philadelphia cream cheese, and a string cheese plant in Campbell turn the whey into biogas. It’s part of the company’s broader efforts to green operations in the areas of agriculture, packaging, energy, water, waste and transportation. "Our facilities have previously used strategies such as concentrating the whey to reduce volume and finding outlets for it to be used as animal feed, or for fertilizer on environmentally approved farm fields," said Sustainability Vice President Steve Yucknut.
"Both methods required transporting the whey off-site. Now, we’re reducing the associated CO2 emissions that are part of transporting waste, discharging cleaner wastewater from our on-site treatment systems, and creating enough alternative energy to heat more than 2,600 homes in the Northeast." The company’s broader goals include reducing energy consumption and energy-related CO2 by 25 percent, and manufacturing plant waste by 15 percent. Rather than sending it to landfills, companies from across several sectors are increasingly viewing waste as a commodity. General Motors, for example, recently announced that half of its manufacturing plants worldwide would reach landfill-free status by 2010, with scrap metal sales topping $1 billion. McDonald’s successfully transformed waste into electricity earlier this year at several United Kingdom restaurants, while Chrysler is converting used paint solids from two St. Louis assembly plants into electricity. Heinz also is working on a program to transform used potato peels into energy.
Interesting2:
The Lake Tanganyika area, in southeast Africa, is home to nearly 130 million people living in four countries that bound the lake, the second deepest on Earth. Scientists have known that the region experiences dramatic wet and dry spells, and that rainfall profoundly affects the area’s people, who depend on it for agriculture, drinking water and hydroelectric power. Scientists thought they knew what caused those rains: a season-following belt of clouds along the equator known as the Intertropical Convergence Zone (ITCZ). Specifically, they believed the ITCZ and rainfall and temperature patterns in the Lake Tanganyika area marched more or less in lockstep. When the ITCZ moved north of the equator during the northern summer, the heat (and moisture) would follow, depriving southeast Africa of moisture and rainfall. When the ITCZ moved south of the equator during the northern winter, the moisture followed, and southeast Africa got rain.
Now a Brown-led research team has discovered the ITCZ may not be the key to southeast Africa‘s climate after all. Examining data from core sediments taken from Lake Tanganyika covering the last 60,000 years, the researchers report in this week’s Science Express that the region’s climate instead appears to be linked with ocean and atmospheric patterns in the Northern Hemisphere. The finding underscores the interconnectedness of the Earth’s climate — how weather in one part of the planet can affect local conditions half a world away. The discovery also could help scientists understand how tropical Africa will respond to global warming, said Jessica Tierney, a graduate student in Brown’s Geological Sciences Department and the paper’s lead author.
Interesting3:
Abrupt climate change is a potential menace that hasn’t received much attention. That’s about to change. Through its Climate Change Prediction Program, the U.S. Department of Energy’s Office of Biological and Environmental Research (OBER) recently launched IMPACTS – Investigation of the Magnitudes and Probabilities of Abrupt Climate Transitions – a program led by William Collins of Berkeley Lab’s Earth Sciences Division (ESD) that brings together six national laboratories to attack the problem of abrupt climate change, or ACC. Sparked by the 2007 Nobel Peace Prize that was shared by Al Gore and the Intergovernmental Panel on Climate Change (IPCC), the reality of global warming finally got through to the majority of the world’s population. Most people think of climate change as something that occurs only gradually, however, with average temperature changing two or three degrees Celsius over a century or more; this is the rate at which ‘forcing’ mechanisms operate, such as the accumulation of carbon dioxide in the atmosphere due to the burning of fossil fuels or widespread changes in land use.
But climate change has occurred with frightening rapidity in the past and will almost certainly do so again. Perhaps the most famous example is the reverse hiccup in a warming trend that began 15,000 years ago and eventually ended the last ice age. Roughly 2,000 years after it started, the warming trend suddenly reversed, and temperatures fell back to near-glacial conditions; Earth stayed cold for over a thousand years, a period called the Younger Dryas (named for an alpine wildflower). Then warming resumed so abruptly, that global temperatures shot up 10 °C, in just 10 years. Because civilizations hadn’t yet emerged, complex human societies escaped this particular roller-coaster ride. Nevertheless, some form of abrupt climate change is highly likely in the future, with wide-ranging economic and social effects.
Interesting4:
The Caribbean and GulfCoast have seen a spate of devastating hurricanes in recent years that have cost billions of dollars and thousands of lives. As residents recover from the latest hits, they may wonder about the potential for future Ike’s and Katrina’s. Hurricanes, of course, are nothing new to the Atlantic and Gulf of Mexico, where tropical storms form between June and November each year. But many factors, both natural and man-made, can affect the number, strength, size and impact of the storms that form each season. For example, the recent surge in storms followed an almost two-decade lull that was part of a natural cycle in hurricane formation. During that lull, new coastal residents built homes in what they thought was a paradise. But now they’ve found out just how susceptible they are to nature’s wrath. And it looks like the situation might only get worse. In 2003, more than half the U.S. population (or about 153 million people) lived along the Gulf and Southeastern U.S. coastline — an increase of 33 million people from 1980 — and that number is just expected to keep rising.
The buildup of these communities in recent decades and the environmental damage that development has caused exacerbate the impact of hurricanes. "There’s been an explosion of population along our coast," said Amanda Staudt, a climate scientist with the National Wildlife Federation (NWF). "That’s just putting a lot more people in harm’s way." This is particularly true in Florida, Texas and North Carolina, where populations are increasing the fastest. Hurricanes are especially a threat for homes right on the beach or on barrier islands, such as Galveston, because they receive the full brunt of a hurricane’s storm surge. Coastal features such as barrier islands and wetlands act as natural protection against a hurricane’s storm surge, slowing it down and absorbing some of the impact. Studies have shown that every mile of wetlands reduces storm surge by about 3 to 9 inches and every acre reduces the cost of damages from a storm by $3,300, Staudt said. "Our wetlands and barrier islands … are our first line of defense," she said.
Air Temperatures – The following maximum temperatures were recorded across the state of Hawaii Thursday afternoon:
Lihue, Kauai – 84 Honolulu, Oahu – 89 Kaneohe, Oahu – 85 Kahului, Maui – 86 Hilo, Hawaii – 84
Kailua-kona – 85 Air Temperaturesranged between these warmest and coolest spots near sea level, and on the highest mountains…at 4 p.m. Thursday afternoon:
Port Allen, Kauai – 88F Hilo, Hawaii– 78
Haleakala Crater- 59 (near 10,000 feet on Maui)
Mauna Kea summit – 46 (near 14,000 feet on the Big Island) Precipitation Totals – The following numbers represent the largest precipitation totals (inches) during the last 24 hours on each of the major islands, as of Thursday afternoon:
0.01 Hanapepe, Kauai
0.18 Maunawili, Oahu
0.01 Molokai
0.00 Lanai
0.20 Kahoolawe 0.44 Puu Kukui, Maui
0.17 Kapapala Ranch, Big Island Weather Chart – Here’s the latest (automatically updated) weather mapshowing two fairly weak high pressure systems located to the north, and far to the east-northeast of Hawaii. This pressure configuration will keep trade winds on the light side light side Friday and Saturday.
Satellite and Radar Images: To view the cloud conditions we have here in Hawaii, please use the following satellite links, starting off with theInfrared Satellite Image of the islands to see all the clouds around the state during the day and night. This next image is one that gives close images of the islands only during the daytime hours, and is referred to as a Close-up visible image. This next image shows a larger view of the Pacific…giving perspective to the wider ranging cloud patterns in the Pacific Ocean. To help you keep track of where any showers may be around the islands, here’s the latest animatedradar image.
Hawaii’s Mountains – Here’s a link to the live webcam on the summit of near 14,000 footMauna Kea on the Big Island of Hawaii. The tallest peak on the island of Maui is theHaleakala Crater, which is near 10,000 feet in elevation. These two webcams are available during the daylight hours here in the islands…and when there’s a big moon rising just after sunset for an hour or two! Plus, during the nights and early mornings you will be able to see stars, and the sunrise too…depending upon weather conditions.
The trade winds will slip down into the light category now through Saturday…then pick up again starting Sunday for several days.These trade winds won’t go away completely, but will be lighter in general. The computer models show them increasing in strength again Sunday for a couple of days, then get lighter Tuesday and Wednesday…only to finish off next week in the moderate to strong realms. In other words, the trade winds will stick around through the next 7-10 days, with variations in speed on a daily basis.
As the trade winds slow down now, we’ll still see a few showers falling along the windward sides…in addition to more showers over the leeward slopes during the afternoons soon.The night and early morning hours will be the favored time of day for the windward biased showers. The light winds, along with the daytime heating of the islands, will cause clouds to congregate over and around the leeward slopes during the afternoons…with a few showers. We may see an increase in showers, which could be locally heavy later this weekend into early next week.
It’s early Thursday evening here in Kihei, Maui, as I begin writing this last paragraph of today’s tropical weather narrative from Hawaii. The computer models continue showing an upper level low pressure system moving over the islands Sunday into early next week. The cold air aloft in association with this upper air feature, could enhance our windward biased showers, and cause showers to increase over the leeward slopes then too. ~~~ Fortunately, the trade winds will stick around, and our high pressure ridge will remain north of Kauai. This will keep us with at least some light breezes, and also keep the volcanic haze from moving up from the Big Island over the other islands. We’re seeing repeated efforts by early season cold fronts lately, which are trying to move down towards the tropics. None of them have made it down into our latitudes, but as they press further south, that’s what’s causing our trade winds to falter more and more often these days. It’s just a matter of time before one of these is able to force its way down to our islands…although that may be awhile yet. ~~~ Thursday was another nice day here in the islands, with a pleasant combination of light to moderately strong trade winds, along with sunny to partly cloudy skies in general. As we move through the next three days, there may be some additional cloudiness in the afternoon hours, which may lead to some increase in showers…especially in the Saturday through Monday time frame. ~~~ I’ll be back well before daybreak Friday morning with your next new weather narrative, I hope you have a great Thursday night until then! Aloha for now…Glenn.
Interesting:
Australian scientists have discovered hundreds of new coral and marine species on the Great Barrier Reef and Ningaloo Reef which they say will improve monitoring reef biodiversity and the impact of climate change. Three expeditions to the reefs over four years to collect the first inventory of soft corals found 300, of which 130 were new species. Dozens of new marine species were found, such as shrimp-like animals with claws longer than their bodies, along with already known animals like a tongue-eating isopod parasite that eats a fish’s tongue and then resides in its mouth. "We were all surprised and excited to find such a large variety of marine life never before described, most notably soft coral, isopods, tanaid (small, bottom-dwelling) crustaceans and worms, and in waters that divers access easily and regularly," said Julian Caley, research scientist at the Australian Institute of Marine Science (AIMS). The marine inventory, being carried out globally as part of a 2010 census of reefs, will allow better understanding of reef biodiversity and climate change, said the AIMS report.
"Corals face threats ranging from ocean acidification, pollution, and warming to overfishing and starfish outbreaks," AIMS chief executive Ian Poiner said in a statement. "Only by establishing a baseline of biodiversity and following through with later censuses can people know the impact of those threats and find clues to mitigate them," said Poiner. The scientists said other major finds included about 100 new isopods, often called "vultures of the sea" because some feed on dead fish. Some two thirds of the species found on LizardIsland on the Great Barrier Reef may be new, along with many polychaetes or "bristle worms", a relative of leeches and earthworms. "The new Australian expeditions reveal how far we are from knowing how many species live in coral reefs around the globe. Estimates span the huge range from 1 to 9 million," marine scientist Nancy Knowlton from the Smithsonian Institution, Washington, said in a statement.
Interesting2:
China‘s capital started pumping "emergency" water from its long-parched neighboring province on Thursday, with officials speaking of a "grim" shortfall weeks after the Olympics when they said the city had enough water.Hebei, which surrounds Beijing, will pump 300 million cubic meters of water to the capital from three dams which usually supply nearby farms, towns and cities. Officials said the capital faced a serious shortfall but made no secret of the strains the transfer places on Hebei, which faces its own chronic water scarcity. "Owing to continuous drought in recent years, the water situation in the capital Beijing is grim and water sources are quite strained," said a statement on the website, adding that the two governments had reached an agreement on the supplies.
"This water is being transferred in circumstances when our province’s water resources are extremely scarce and is an emergency transfer." The water will flow through a 309-km (192-mile) canal quickly built for the Beijing Olympics that will later form part of the larger South-to-North Water Transfer Project. During the Games in August, city officials said they did not need the "emergency" supplies that Hebei and nearby provinces set aside in case the "green" Games host city faced shortages. "I believe the Olympic Games will not pose a big challenge to water supplies in the city," Water Ministry official Hu Siyi told reporters in mid-August. But as north China approaches the dry winter season, officials said Beijing now needs the supplies. Hebei will pump the extra supplies for 174 days until March 2009, the provincial water office said.
Interesting3:
Field researchers have sighted the hairy-nosed otter, the world’s rarest, in a national park in southern Vietnam, a conservation group announced Thursday. Nguyen Van Nhuan, a research officer at Vietnam‘s Carnivore and Pangolin Conservation Programme, said he came face-to-face with two of the endangered animals in March while doing night observations in U Minh Ha National Park in the Mekong Delta. The species was believed extinct in the 1990s, but has recently been seen in several south-east Asian countries. Nhuan’s was the first sighting in Vietnam since 2000. "We could not believe our eyes," Nhuan said. "Suddenly two hairy-nosed otters! I have never had a special feeling like that." An official of the Carnivore and Pangolin Conservation Programme said the group had hesitated to release news of the sighting for fear of revealing the otter’s presence to hunters, but had decided to publicize it now because of threats to the animal’s habitat.
Nhuan said the otters’ habitat was being fragmented by development in and around the 8,000-hectare U Minh Ha park. A state-owned forestry company engages in intensive planning and harvesting of melaleuca trees, and locals have admitted hunting the otters for fur, for use in traditional Chinese medicine, and to keep as pets. The water quality in the park has been degraded by motorboats lured by new ecotourism projects, according to Nhuan. "Due to ecotourism development, there’s a lot of rubbish," Nhuan said. "The ecotourism project is using a lot of land to build its headquarters, hotel rooms and a recreation area." Scientists know relatively little about hairy-nosed otters, which are notoriously shy and mostly nocturnal. They eat fish, frogs, reptiles, snakes, and insects.
Interesting4:
When you have a headache, you take a couple aspirin, but when plants get stressed out, they just make their own. Scientists had known that plants in laboratories produce a chemical called methyl salicylate — a form of the painkiller aspirin — when stressed out, but they had never detected it in plants out in nature. A team of scientists from the National Center for Atmospheric Research (NCAR) in Boulder, Colo., discovered by accident plants in the wild emitting methyl salicylate. They set up instruments last year in a walnut grove near Davis, Calif., to monitor plant emissions of certain volatile organic compounds (or VOCs). VOCs emitted by plants can actually combine with industrial emissions and contribute to smog. To their surprise, the NCAR scientists found that the emissions of VOCs their instruments recorded in the atmosphere included methyl salicylate.
They noticed that the methyl salicylate emissions increased dramatically when the plants, already stressed by a local drought, experienced unseasonably cool nighttime temperatures followed by large temperature increases during the day. Scientists think that the methyl salicylate has two functions: stimulating a process similar to the immune response in animals that helps plants resist and recover from disease, and acting as a form of chemical communication to warn neighbors of threats. "These findings show tangible proof that plant-to-plant communication occurs on the ecosystem level," said study team member Alex Guenther. "It appears that plants have the ability to communicate through the atmosphere."
Air Temperatures – The following maximum temperatures were recorded across the state of Hawaii Wednesday afternoon:
Lihue, Kauai – 84 Honolulu, Oahu – 88 Kaneohe, Oahu – 85 Kahului, Maui – 87 Hilo, Hawaii – 80
Kailua-kona – 83 Air Temperaturesranged between these warmest and coolest spots near sea level, and on the taller mountains…at 4 p.m. Wednesday afternoon:
Port Allen, Kauai – 88F Hilo, Hawaii– 78
Haleakala Crater- 54 (near 10,000 feet on Maui)
Mauna Kea summit – 50 (near 14,000 feet on the Big Island) Precipitation Totals – The following numbers represent the largest precipitation totals (inches) during the last 24 hours on each of the major islands, as of Wednesday afternoon:
0.07 Mount Waialeale, Kauai
0.13 Kaneohe, Oahu
0.02 Molokai
0.00 Lanai
0.00 Kahoolawe 0.10 Hana airport, Maui 0.55 Pahoa, Big Island Weather Chart – Here’s the latest (automatically updated) weather mapshowing two fairly weak high pressure systems located to the north-northwest, and east-northeast of Hawaii. This pressure configuration will keep our winds light Thursday and Friday.
Satellite and Radar Images: To view the cloud conditions we have here in Hawaii, please use the following satellite links, starting off with theInfrared Satellite Image of the islands to see all the clouds around the state during the day and night. This next image is one that gives close images of the islands only during the daytime hours, and is referred to as a Close-up visible image. This next image shows a larger view of the Pacific…giving perspective to the wider ranging cloud patterns in the Pacific Ocean. To help you keep track of where any showers may be around the islands, here’s the latest animatedradar image.
Hawaii’s Mountains – Here’s a link to the live webcam on the summit of near 14,000 footMauna Kea on the Big Island of Hawaii. The tallest peak on the island of Maui is theHaleakala Crater, which is near 10,000 feet in elevation. These two webcams are available during the daylight hours here in the islands…and when there’s a big moon rising just after sunset for an hour or two! Plus, during the nights and early mornings you will be able to see stars, and the sunrise too…depending upon weather conditions.
Aloha Paragraphs
Hidden north shore beaches on Kauai Photo Credit: flickr.com
The trade winds will continue blowing through the rest of this week into the next…varying in strength from day to day.These balmy breezes won’t be strong enough to trigger small craft wind advisories, although certainly be able to bring their cooling and refreshing relief from the late summer heat. The trade winds will pick up some in strength during the second half of the upcoming weekend…continuing right on into next week.
The bias for showers will remain focused on the windward coasts and slopes.The night and early morning hours will be the favored time of day for these showers. There will be some clouds gathering over and around the leeward slopes during the afternoons too, but showers will be limited for the time being. We may see an increase in showers, which could be locally heavy later this weekend into early next week.
It’s early Wednesday evening here in Kihei, Maui, as I begin writing this last paragraph of today’s tropical weather narrative from Hawaii. The computer models continue showing a change coming our way later this weekend, when an upper level low pressure system moves over the islands Sunday into early next week. The cold air aloft in association with this upper air feature, could enhance our windward biased showers, and cause showers to increase over the leeward slopes then too. Some of these showers could be locally heavy over the upcountry slopes on the Big Island and perhaps Maui as well. ~~~ As is often the case during the late afternoon hours here on Maui’s south coast, the trade winds are rather gusty. Looking at the numbers, we find the strongest gust anywhere in the Hawaiian Islands, pushing out to sea across Maalaea Bay…at 33 mph, while the Kahului airport at the same time (5pm), showed 30 mph gusts. The winds will calm down after dark, and remain quite light through the night into the early morning hours. ~~~ Thursday looks to be yet another nice looking day here in the islands, as will Friday and Saturday for that matter. I’ll be back very early Thursday morning with your next new weather narrative from paradise, I hope you have a great Wednesday night until then! Aloha for now…Glenn.
Interesting:
The search for sustainable energy has never been stronger as climate change concerns drive government, scientists, business and environmentalists around the world in a headlong charge for affordable new technologies. Sources ranging from electricity, wind, biofuel and through solar, geothermal and nuclear to hybrids, fuel cells and methane retrieval _ and many, many more energy possibilities _ are being pursued frantically and expensively. One of the most readily apparent sources _ tidal power _ has been slow to capture the imagination although a Singapore company is keenly eyeing The Rip off Queenscliff for water turbines that might power up to 1000 houses. Atlantis Power Resources has been testing a turbine in CorioBay and if its plans are approved would utilise two turbines in The Rip, exploiting the great mass of water that rushes through the Port Phillip Heads twice a day. It claims its systems would be silent, out of sight and environmentally clean.
At first blush, the tidal turbines sound a good idea. Certainly, they’re not a new idea; late Geelong mayor Howard Glover was calling for some similar arrangement two decades ago. And hardly surprising, really. The power surging through The Rip is phenomenal. No less than 4 per cent of Port Phillip Bay‘s 25 cubic kilometres volume _ a cubic kilometre of water _ is exchanged on every tide. Harnessing this power properly would be difficult because the narrow entrance to the bay makes tidal movements unusual. But the potential is abundantly clear _ and more reliable than wind and sun, cleaner than coal, lacking radioactive half-life problems, easier to extract than fossil fuels. And Atlantis appears to be relatively modest in its ambition, suggesting it could power 1000 houses through tidal power fed directly into the grid. Interesting2:
For the first time in waters surrounding New York City, the beckoning calls of endangered fin, humpback and North Atlantic right whales have been recorded, according to experts from the Bioacoustics Research Program at the Cornell Lab of Ornithology and the New York State Department of Environmental Conservation (DEC). "This is an exciting time for New Yorkers. Just think, just miles from the Statue of Liberty, the EmpireStateBuilding, Carnegie Hall and Times Square, the great whales are singing," says Chris Clark, the Director of the Bioacoustics Research Program at the Cornell Lab of Ornithology. "These are some of the largest and rarest animals on this planet trying to make a living just a few miles from New York‘s shores. It just goes to show us that there are many important and wonderful discoveries to be made about the living world right here, right in our back yards."
"With data generated by acoustic monitoring, we can better understand New York‘s role in the life history of these endangered whales and make more informed conservation decisions," says James Gilmore, chief of the DEC’s Bureau of Marine Resources. "This is especially important for the survival of right whales." The recorders were placed about 13 miles from the New YorkHarbor entrance and off the shores of Fire Island. Information about the seasonal presence of whales will help New York state policymakers develop management plans to protect them. Knowing the whales’ travel paths will help ship traffic managers avoid whale collisions in New York waters. Further, the study will characterize New York waters’ acoustic environment and examine whether underwater noises, including shipping, affect the whales.
Interesting3:
For the 30th consecutive year, the Earth’s summer temperature was above average, according to data released Tuesday by the National Climatic Data Center. Global temperatures were the ninth-warmest since records began in 1880. (Climatologists define summer as the months of June, July and August.) Measuring just the globe’s land areas, it was the seventh-warmest summer on record. The summer was unusually warm in most of the USA, Mexico, Europe, Australia, the British Isles, Asia and South America, while cooler-than-average conditions were recorded across the western and southern coast of Alaska, parts of northern Scandinavia and northwestern Russia. Additionally, the National Snow and Ice Data Center reported Tuesday that Arctic sea ice melted to its second-lowest level on record, just slightly more than the 2007 record-low. Given trends of the past 30 years, likely triggered by man-made global warming, scientists predict that within five to 10 years, the Arctic could be entirely ice-free in the summer.
Air Temperatures – The following maximum temperatures were recorded across the state of Hawaii Tuesday afternoon:
Lihue, Kauai – 85 Honolulu, Oahu – 87 Kaneohe, Oahu – 85 Kahului, Maui – 86 Hilo, Hawaii – 82
Kailua-kona – 84 Air Temperaturesranged between these warmest and coolest spots near sea level, and on the taller mountains…at 4 p.m. Tuesday afternoon:
Barking Sands, Kauai – 85F Princeville, Kauai– 81
Haleakala Crater- 54 (near 10,000 feet on Maui)
Mauna Kea summit – 48 (near 14,000 feet on the Big Island) Precipitation Totals – The following numbers represent the largest precipitation totals (inches) during the last 24 hours on each of the major islands, as of Tuesday afternoon:
0.08 Wailua, Kauai
0.04 Dillingham, Oahu
0.01 Molokai
0.00 Lanai
0.00 Kahoolawe 0.37 Puu Kukui, Maui
0.32 Pahoa, Big Island Weather Chart – Here’s the latest (automatically updated) weather mapshowing a 1022 millibar high pressure system located to the east-northeast of Hawaii…with its associated ridge, located northeast of the islands. This pressure configuration will keep our winds light to moderately strong Wednesday and Thursday…locally stronger and gusty. Satellite and Radar Images: To view the cloud conditions we have here in Hawaii, please use the following satellite links, starting off with theInfrared Satellite Image of the islands to see all the clouds around the state during the day and night. This next image is one that gives close images of the islands only during the daytime hours, and is referred to as a Close-up visible image. This next image shows a larger view of the Pacific…giving perspective to the wider ranging cloud patterns in the Pacific Ocean. To help you keep track of where any showers may be around the islands, here’s the latest animatedradar image.
Hawaii’s Mountains – Here’s a link to the live webcam on the summit of near 14,000 footMauna Kea on the Big Island of Hawaii. The tallest peak on the island of Maui is theHaleakala Crater, which is near 10,000 feet in elevation. These two webcams are available during the daylight hours here in the islands…and when there’s a big moon rising just after sunset for an hour or two! Plus, during the nights and early mornings you will be able to see stars, and the sunrise too…depending upon weather conditions.
Aloha Paragraphs
A bonfire on Hanalei beach…Kauai Photo Credit: flickr.com
Light to moderately strong trade winds will continue through mid-week, stronger and gusty in those usual windier locations…then get softer Friday into the weekend.The trade winds returned Monday, and did a good job of ventilating our hazy atmosphere of the recent volcanic emissions…which got carried over the entire state this past weekend. The trade winds will bring their cooling and refreshing relief from the sultry weather of late too. These cooling and refreshing trade winds will remain quite active through Thursday…then slip a notch or two in strength through the rest of the week.
Whatever showers that fall here in the islands, will generally be deposited along the windward sides.The night and early morning hours will be the favored time of day for these showers. This satellite image shows scattered clouds being carried towards our islands on the trade winds. There will be some clouds gathering over and around the leeward sides during the afternoons too, but showers will be few and far between. Rainfall will generally be light through the week…with nothing heavy on the horizon at this time.
It’s early Tuesday evening here in Kihei, Maui, as I begin writing this last paragraph of today’s tropical weather narrative from Hawaii.The trade winds will be easing back into the lighter realms later this week, but unlike this past weekend, they shouldn’t go away altogether. The reason for these lighter trade wind periods, are gale low pressure systems far to our north, along with their associated cold fronts, pushing our trade wind producing high pressure ridge southward towards Kauai. When the ridge gets closer, our winds slack-off…then pick up again when the ridge migrates further north. The computer forecast models continue to show an early autumn cold front approaching the islands early next week, which may push our ridge right down over the islands. This in turn could turn off the trade winds, and swing our winds around to the southeast…bringing back another round of voggy weather then. The cold front itself doesn’t look like it will bring showers to Hawaii however. ~~~ Looking out the window here in the south coast of Maui, besides the vog free atmosphere, there are hardly any clouds in the sky…while the trade winds are breezy. How breezy you might wonder? Well, the strongest gusts anywhere in the state late Tuesday afternoon where: 30 mph at Kapalua, and 36 mph at Maalaea Bay, both here on Maui. ~~~ I’ll be back here very early early Wednesday morning with your next new weather narrative, I hope you have a great Tuesday night until then! Aloha for now…Glenn.
Interesting:The hole in the ozone layer over Antarctica has already surpassed its 2007 size this year, and is set to keep growing for another few weeks, the U.N. weather agency said on Tuesday. The Antarctic ozone hole appears every year and normally stretches to about the size of North America, reaching its maximum size in late September or early October. But in 2008, the World Meteorological Organization said the protective layer, which shields the Earth from ultra-violet rays that can cause skin cancer, began to thin relatively late. "During the last couple of weeks it has grown rapidly and has now passed the maximum size attained in 2007. Since the ozone hole is still growing, it is too early to determine how large this year’s ozone hole will be," it said in a statement. The ozone hole covered 27 million square km as of last Saturday (September 13), against 25 million square km at its peak last year, according to the WMO whose statement was issued on International Day for the Preservation of Ozone Layer. Interesting2:
Utility-scale wind power is an important and growing part of the US energy portfolio. Farms ranging in size from dozens to hundreds of turbines can produce in excess of 60 megawatts of power. Plans for gigawatts of wind power are being proposed all over the globe, and new wind farms are regularly being proposed that outstrip one another to be the largest in their respective locations, or in the world. At the far end of the scale, the largest size wind turbines have a rotor diameter of 126 meters (413 feet), and are estimated to be capable of producing 20,000,000 kilowatt hours of electricity annually (enough to power as many as 5000 European homes).
Since the power generated by a turbine increases exponentially as it gets larger, new turbines will continue to grow in size. But small-scale turbines are perhaps a more exciting realm of development. The standard, propeller-style turbine is well established, and there are many suppliers for this kind of generator in a range of sizes. In 2007, Home Power Magazine had a roundup of more than a dozen small wind turbines ranging from 8 feet to 56 feet in diameter (the latter of which is far larger than even a large, inefficient household would need for their power requirements). Green Building Elements had a review of this article last year.
Interesting3:
In a few weeks, American shoppers will be able to look at a cut of meat or a pound of hamburger and see something they’ve never seen before-a label that says where the meat came from. Starting Sept. 30, food manufacturers and grocery stores have to comply with a new federal law that requires "Country of Origin Labeling," or COOL, on beef, pork, chicken and lamb. The new labels will tell consumers whether their food came from animals raised in the U.S. or another country. The law also covers perishable items, such as fruits and vegetables and a variety of nuts. Some say this will enable consumers to avoid food that, for example, comes from countries that they have heard have food safety problems. It also will allow consumers to stick to American-grown food, if that is their preference.
Because of the complexities of the livestock industry, some product labels may list multiple countries. That’s especially true of ground beef, because some meat processors combine cuts from a number of countries to make ground meat and hamburger patties. Food safety groups have hailed COOL as a necessary step toward broader consumer education and buying choices. But now they complain that the Department of Agriculture has defined it as narrowly as possible. For example, they say, the agency has defined a host of foods as "processed," such as mixed frozen vegetables, which exempts them from the new law. "When they finalized this rule, they bent over backward to make as few things be covered as possible," said Michael Hansen, a senior staff scientist with Consumers Union. "There are giant, giant loopholes in the law."
Air Temperatures – The following maximum temperatures were recorded across the state of Hawaii Monday afternoon:
Lihue, Kauai – 85 Honolulu, Oahu – 89 Kaneohe, Oahu – 84 Kahului, Maui – 88 Hilo, Hawaii – 83
Kailua-kona – 85 Air Temperaturesranged between these warmest and coolest spots near sea level, and on the taller mountains…at 4 p.m. Monday afternoon:
Barking Sands, Kauai – 87F Hilo, Hawaii– 77
Haleakala Crater- 50 (near 10,000 feet on Maui)
Mauna Kea summit – 46 (near 14,000 feet on the Big Island) Precipitation Totals – The following numbers represent the largest precipitation totals (inches) during the last 24 hours on each of the major islands, as of Monday afternoon:
0.58 Hanapepe, Kauai 0.96 Kalaeloa airport, Oahu
0.04 Molokai
0.00 Lanai
0.10 Kahoolawe 0.34 Oheo Gulch, Maui
0.42 Waiakea Uka, Big Island Weather Chart – Here’s the latest (automatically updated) weather mapshowing a 1022 millibar high pressure system located to the northeast of Hawaii…with its associated ridge, located northeast of the islands. This pressure configuration will keep our winds light to moderately strong Tuesday and Wednesday. Satellite and Radar Images: To view the cloud conditions we have here in Hawaii, please use the following satellite links, starting off with theInfrared Satellite Image of the islands to see all the clouds around the state during the day and night. This next image is one that gives close images of the islands only during the daytime hours, and is referred to as a Close-up visible image. This next image shows a larger view of the Pacific…giving perspective to the wider ranging cloud patterns in the Pacific Ocean. To help you keep track of where any showers may be around the islands, here’s the latest animatedradar image.
Hawaii’s Mountains – Here’s a link to the live webcam on the summit of near 14,000 footMauna Kea on the Big Island of Hawaii. The tallest peak on the island of Maui is theHaleakala Crater, which is near 10,000 feet in elevation. These two webcams are available during the daylight hours here in the islands…and when there’s a big moon rising just after sunset for an hour or two! Plus, during the nights and early mornings you will be able to see stars, and the sunrise too…depending upon weather conditions.
Light trade winds began filtering back into our Hawaiian Islands Monday, which will strengthen into Tuesday.The light SE breezes this past weekend, brought lots of volcanic haze up over the islands, from the vents on the Big Island. Monday started off with poor air visibilities, although by the afternoon hours, the trade winds had nicely begun clearing our local atmosphere. It will take until Tuesday before we see normal air visibilities. The trade winds will continue blowing through the rest of new week…getting lighter again Thursday.
Now that the trade winds have returned, the bias for showers will move back over to the windward sides.The night and early morning hours will be the favored time of day for these mostly light showers. There may still be some clouds gathering over and around the mountains during the afternoon, with a few showers falling locally. Rainfall will generally be light through the upcoming week…with nothing heavy on the horizon at this time.
It’s early Monday evening here in Kihei, Maui, as I begin writing this last paragraph of today’s tropical weather narrative from Hawaii.The trade winds returned right on schedule today, helping to clear the muggy conditions away, and more importantly…the leftover volcanic haze from this past weekend. Looking out the window, before I leave for home, the skies are almost completely clear of clouds, with hardly a trace of volcanic haze! This is good news, as we love our cooling and refreshing trade winds. The rest of the week looks favorably inclined weatherwise, although with the trade winds getting lighter during the second half of the week, we may turn slightly sultry again then. At that time we may begin to see more clouds over the leeward slopes too, with perhaps a few showers returning. I’ll be back very early Tuesday morning with your next new weather narrative from paradise, I hope you have a great Monday night until then! Aloha for now…Glenn.
Interesting:Nearly half of the seafood we eat today is farmed. And while aquaculture is often equated with pollution, habitat degradation, and health risks, this explosive growth in fish farming may in fact be the most hopeful trend in the world’s increasingly troubled food system, according to a new report by Worldwatch Institute. In Farming Fish for the Future, Senior Researcher Brian Halweil illustrates how, if properly guided, fish farming can not only help feed an expanding global population, but also play a role in healing marine ecosystems battered by overfishing. "In a world where fresh water and grain supplies are increasingly scarce, raising seafood like oysters, clams, catfish, and tilapia is many times more efficient than factory-farmed chicken or beef," says Halweil. "Farmed fish can be a critical way to add to the global diet to hedge against potential crop losses or shortages in the supply of meat." "But not all fish farming is created equal," Halweil notes. Carnivorous species like salmon and shrimp, while increasingly popular, consume several times their weight in fish feed-derived from other, typically smaller, fish-as they provide in edible seafood. "It generally requires 20 kilograms of feed to produce just 1 kilogram of tuna," Halweil says. "So even as we depend more on farmed fish, a growing scarcity of fish feed may jeopardize future expansion of the industry."
Poorly run fish farms can generate coastal pollution in the form of excess feed and manure, and escaped fish and disease originating on farms can devastate wild fisheries. For example, a fish farm with 200,000 salmon releases nutrients and fecal matter roughly equivalent to the raw sewage generated by 20,000 to 60,000 people. Scotland’s salmon aquaculture industry is estimated to produce the same amount of nitrogen waste as the untreated sewage of 3.2 million people-just over half the country’s population. Cramped facilities can also create ill health for fish, costing producers millions of dollars in disease prevention and foregone revenues. In recent years, shrimp farmers in China have lost $120 million to bacterial fish diseases and $420 million to shrimp diseases. Fish farming has expanded to meet the soaring global demand for seafood. On average, each person on the planet is eating four times as much seafood as was consumed in 1950. The average per-capita consumption of farmed seafood has increased nearly 1,000 percent since 1970, in contrast to per-capita meat consumption, which grew just 60 percent. In 2006, fish farmers raised nearly 70 million tons of seafood worth more than $80 billion-nearly double the volume of a decade earlier. Experts predict that farmed seafood will grow an additional 70 percent by 2030.
Interesting2: A new study shows a sharp drop in migratory water bird populations along main migration routes in Africa and Eurasia. The report: ‘Conservation Status of Migratory Wate rbirds in the African-Eurasian Flyways’ prepared by Wetlands International for the African-Eurasian Migratory Water bird Agreement (AEWA), reveals that of 522 studied migratory water bird populations on routes across Africa and Eurasia, 40 per cent are in decline. The report is being presented to delegates from over 80 countries at the Fourth Meeting of the Parties to the African-Eurasian Migratory Water bird Agreement (AEWA) in Antananarivo, Madagascar, today. Simon Delany, Water bird Conservation Officer at the Netherlands-based headquarters of Wetlands International and principal author of the report, said: "The main causes of declining water bird numbers along the African-Eurasian Flyways are the destruction and unsustainable exploitation of wetlands, which are largely driven by poorly-planned economic development."
The main causes of population decrease include, infrastructure development, wetland reclamation, increasing pollution, and hunting pressure. These impacts are in many cases compounded by impacts of climate change and associated phenomena, such as increased frequency of droughts, sea-level rise and changes in Arctic tundra habitats. "Climate change… is likely to affect all ecosystems, but wetlands are especially vulnerable because of their sensitivity to changes in water level and susceptibility to changes in rainfall and evaporation." said Delany. Sea-level rise threatens coastal and inland wetland areas. These are crucial habitats for millions of migratory water birds. Huge numbers of water birds also breed in Arctic tundra habitats which too are threatened by climate change.
Interesting3:NASA’s Phoenix Mars Lander has photographed several dust devils dancing across the arctic plain this week and sensed a dip in air pressure as one passed near the lander. These dust-lofting whirlwinds had been expected in the area, but none had been detected in earlier Phoenix images. The Surface Stereo Imager camera on Phoenix took 29 images of the western and southwestern horizon on Sept. 8, during mid-day hours of the lander’s 104th Martian day. The next day, after the images had been transmitted to Earth, the Phoenix science team noticed a dust devil right away. "It was a surprise to have a dust devil so visible that it stood with just the normal processing we do," said Mark Lemmon of Texas A&M University, College Station, lead scientist for the stereo camera. "Once we saw a couple that way, we did some additional processing and found there are dust devils in 12 of the images." At least six different dust devils appear in the images, some of them in more than one image. They range in diameter from about 2 meters (7 feet) to about 5 meters (16 feet).


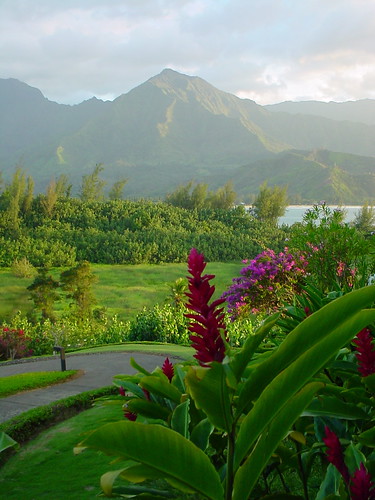
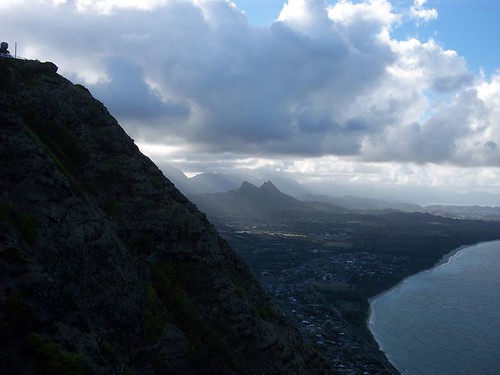
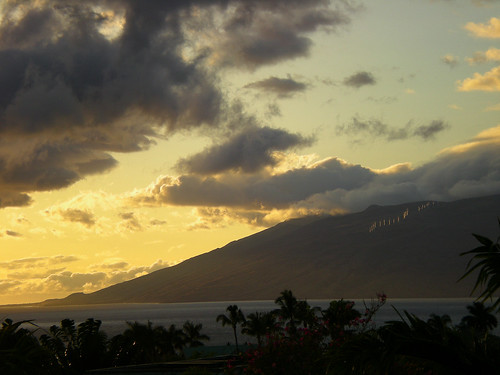
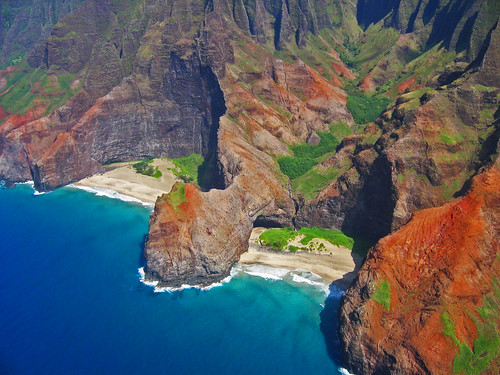
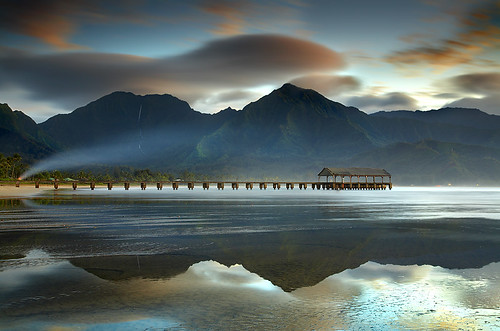


